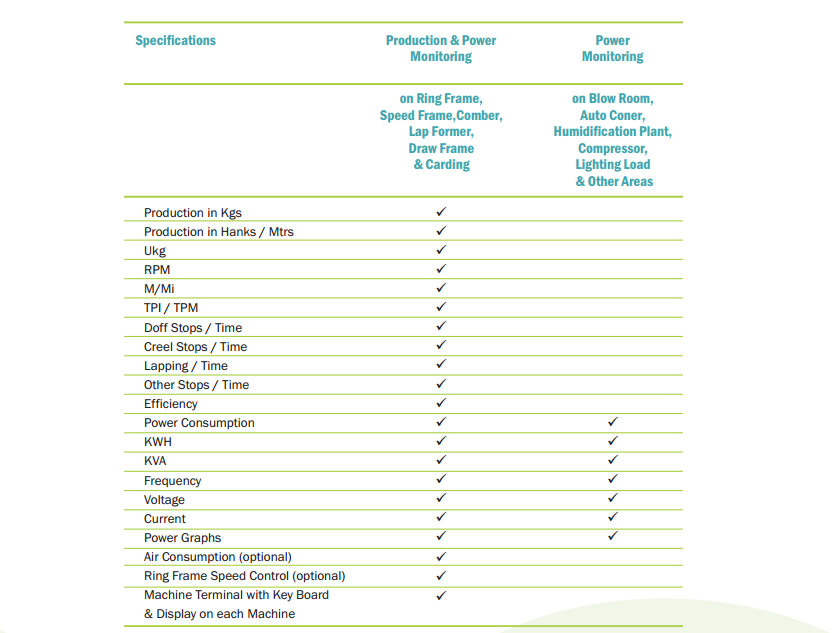
Online Production & Power Monitoring
for Ring Frame, Speed Frame, Comber,Lap Former,Draw Frame, & Carding
Micro Information of each Point
- Identify Weak Areas
- RPM
- TPI
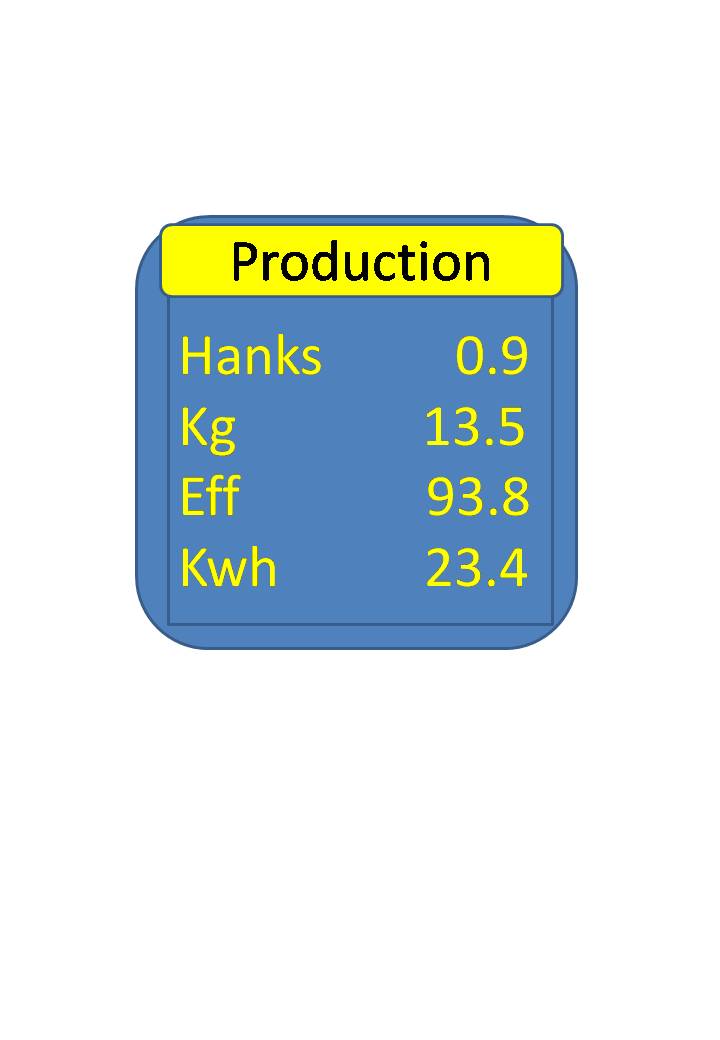
- Production in KGS
- Production in Hanks
- UKG
- Doff Stop
- Creel Stop
- Lapping
- Other Stops
- Cop Buildup vs Speed
Reduces
- Machine Down Time
- Operator Work Load
- Power Cost
- Air Consumption (optional)
Increases
- Productivity
- Power Utilisation
- Operator Efficiency
Optimise**
- Speed Pattern for a lower power consumption
- Balance Cost vs Production
- Prevent avoidable stops
- Monitor Health of Motor
- Identify Mechanical Alignment of Drive Shaft, Bearing, Lubrication
- Compare Various Motors / Machines Running the same Count
- Bring Low performance Machine on par with the best
Online Production & Power Monitoring
for Blow Room, Auto Coner, Humidification Plant,Compressor, Lighting Load & Other Areas
Micro Information of each Point
- Identify Weak Areas
- Voltage
- Current
- PF
- Frequency
- KVA
- KWH
- Power Graphs
Reduces
- Machine Down Time
- Power Cost
Increases
- Productivity
- Power Utilisation
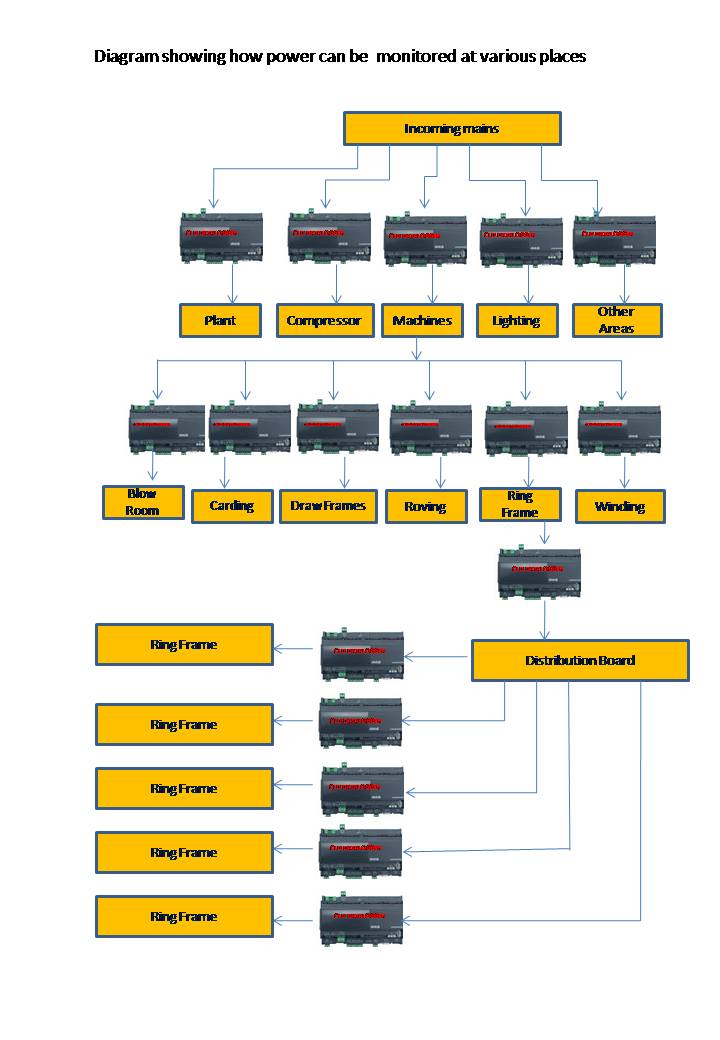
Wiring Diagram of Datalog Power Monitor on Ring Frame

Classic Loom Data at the heart of productivity
When it comes to providing total solutions for textile automation, Classic Loom Data is in a league on its own. Incorporating innovative technologies, Classic Loom Data has quietly established its reputation as a trusted partner in progress for customers cross the Globe. Strong focus on R&D and clear perception of customer requirements have contributed to the company’s ability to provide customised solutions to help improve productivity and quality. Classic Loom Data’s facilities are top-of-the-line. A dedicated team of engineers backed by highly experienced technical people at the helm ensures that every product from their stable delivers results.
Hardware and Software configuration
A Data Collection Unit is installed on each machine to monitor Production and Power data (optional). Data Collection Units are connected through the Data Communication Unit to the Central Computer that generates various reports. Connection from the Data Collection Units to the central computer can be wired or wireless.
Data Collection Unit with LCD Display and Keyboard
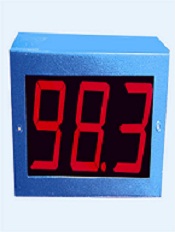
Data Collection Unit with 7 Segment Display – Its viewed by all in shed and it enhance to improve productivity.


Report Sructure
The reports can be called on the screen or on the printer. The user can get all the information at their fingertips
- Text & Graphical Reports
- MachineWise, ArticleWise, OperatorWise, Supervisor Wise, Department Wise
- Production Reports, Stoppage Reports,Doff Report, Doff Prediction Report, Efficiency Reports
- Performance Reports ,Efficiency Trend Graphs,Comparison Reports, Assignment Reports
- Power consumption,Power factor,Units consumed, KVA,etc.,reports related to power
- Power consumed vs Production comparison for each DOFF, Shiftetc.,
Optional Attachements
Centralised LCD Screen
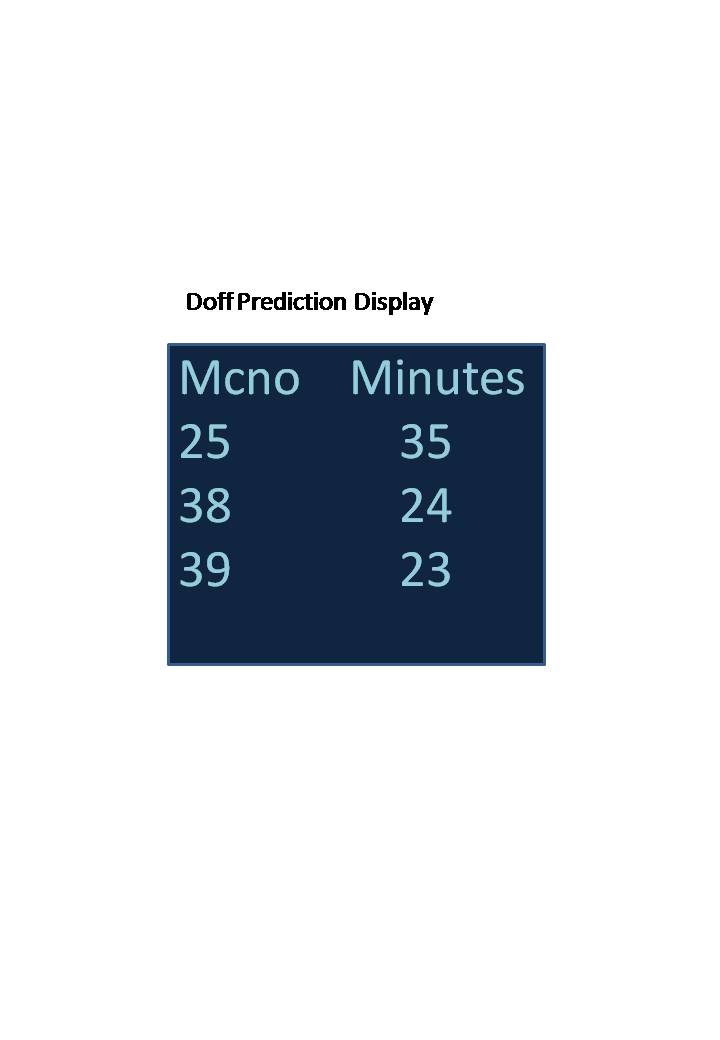
Doff Prediction Display
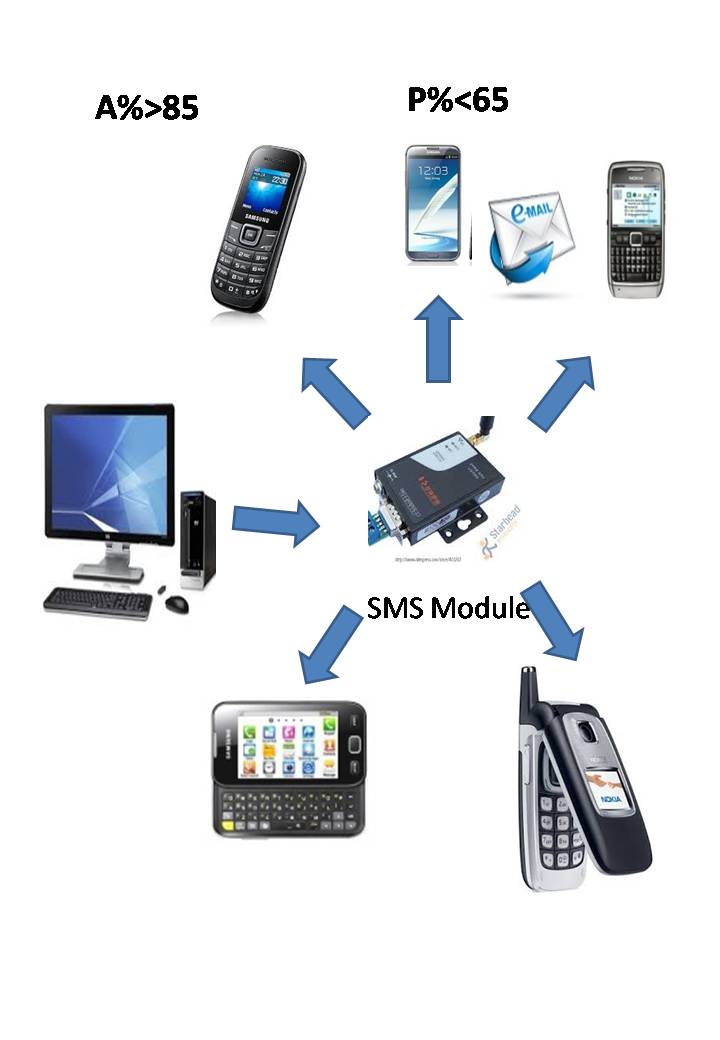
SMS Alters
Score Board